Applying Discrete Differential Geometry to Cryptocurrency Investing
**Discrete Differential Geometry (DDG)** concepts, such as graph Laplacians and clustering analysis, can be applied to cryptocurrency investing to analyze correlations, optimize diversification, and manage risks. By constructing a financial network of cryptocurrencies based on historical data, investors can gain deeper insights into market relationships and clusters of assets. This article provides an in-depth guide and Python implementation.
Key Steps in the Analysis
To apply DDG principles to cryptocurrency investing, the following steps are performed:
- Fetch Historical Data: Use yfinance to retrieve historical cryptocurrency price data.
- Calculate Correlation Matrix: Analyze relationships between daily returns of cryptocurrencies.
- Create a Financial Network: Build a graph where nodes represent cryptocurrencies, and edges represent strong correlations.
- Calculate Graph Laplacian: Analyze the network structure using the Laplacian matrix.
- Cluster Analysis: Use eigenvalues of the Laplacian to identify independent clusters of cryptocurrencies.
- Visualize the Network: Plot the graph to reveal clusters and diversification opportunities.
Python Implementation
The following Python code demonstrates how to implement the above steps:
import numpy as np
import pandas as pd
import networkx as nx
import matplotlib.pyplot as plt
from scipy.linalg import eigh
import yfinance as yf

# Fetch Historical Data Using yfinance
def fetch_crypto_data_yfinance(tickers, start_date, end_date):
    data = yf.download(tickers, start=start_date, end=end_date)['Adj Close']
    return data

# Calculate Correlation Matrix
def calculate_correlation_matrix(price_data):
    daily_returns = price_data.pct_change().dropna()
    return daily_returns.corr()

# Create Financial Network
def create_financial_network(correlation_matrix):
    graph = nx.Graph()
    for i, asset1 in enumerate(correlation_matrix.columns):
        for j, asset2 in enumerate(correlation_matrix.columns):
            if i  0.5:
                graph.add_edge(asset1, asset2, weight=correlation_matrix.iloc[i, j])
    return graph

# Calculate Graph Laplacian
def calculate_graph_laplacian(graph):
    return nx.laplacian_matrix(graph).toarray()

# Analyze Clusters Using Eigenvalues
def analyze_clusters(laplacian, crypto_names):
    eigenvalues, _ = eigh(laplacian)
    print("Eigenvalues of the Laplacian:", eigenvalues)
    return np.sum(eigenvalues > 1e-5)

# Visualize the Financial Network
def plot_financial_network(graph):
    pos = nx.spring_layout(graph, seed=42)
    nx.draw(graph, pos, with_labels=True, node_size=800, node_color="skyblue", font_size=10)
    edge_labels = nx.get_edge_attributes(graph, 'weight')
    nx.draw_networkx_edge_labels(graph, pos, edge_labels=edge_labels)
    plt.title("Cryptocurrency Correlation Network")
    plt.show()

# Main Execution
if __name__ == "__main__":
    tickers = ["BTC-USD", "ETH-USD", "SOL-USD", "XRP-USD", "DOT-USD", "ADA-USD", "MATIC-USD", "LTC-USD"]
    start_date = "2023-09-01"
    end_date = "2023-12-01"

    price_data = fetch_crypto_data_yfinance(tickers, start_date, end_date)
    correlation_matrix = calculate_correlation_matrix(price_data)
    financial_network = create_financial_network(correlation_matrix)
    plot_financial_network(financial_network)
    laplacian = calculate_graph_laplacian(financial_network)
    num_clusters = analyze_clusters(laplacian, correlation_matrix.columns)
    print(f"Suggested number of clusters: {num_clusters}")
Key Outputs
1. Price Data
Historical adjusted closing prices for cryptocurrencies, retrieved using yfinance.
2. Correlation Matrix
A symmetric matrix showing the relationships between daily returns of cryptocurrencies.
3. Cryptocurrency Network Visualization
A graph where nodes represent cryptocurrencies, and edges represent strong correlations. 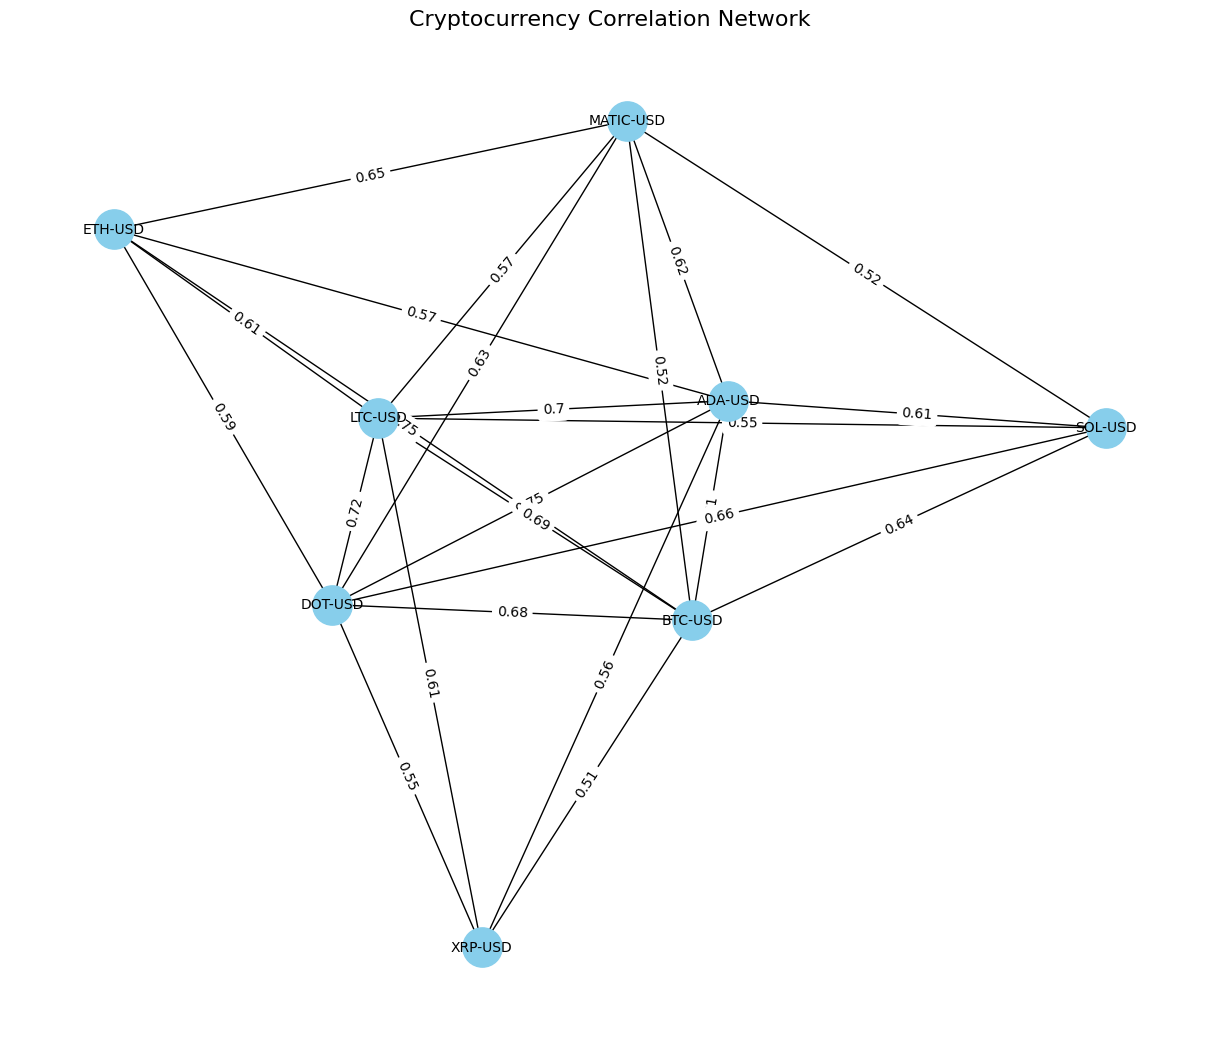
4. Graph Laplacian and Clusters
The Laplacian matrix reveals the structure of the financial network. Eigenvalues identify the number of independent clusters, helping to diversify investments.
Applications in Cryptocurrency Investing
- Portfolio Diversification: Identify clusters of highly correlated cryptocurrencies to avoid redundancy.
- Risk Management: Detect systemic risks by analyzing interdependencies.
- Adaptive Strategies: Dynamically adjust portfolio weights based on evolving clusters.
Conclusion
By applying DDG concepts like graph Laplacians and clustering, cryptocurrency investors can gain valuable insights into market relationships and manage portfolios more effectively. This framework enables better diversification, risk management, and adaptability in volatile crypto markets.